Financial Models
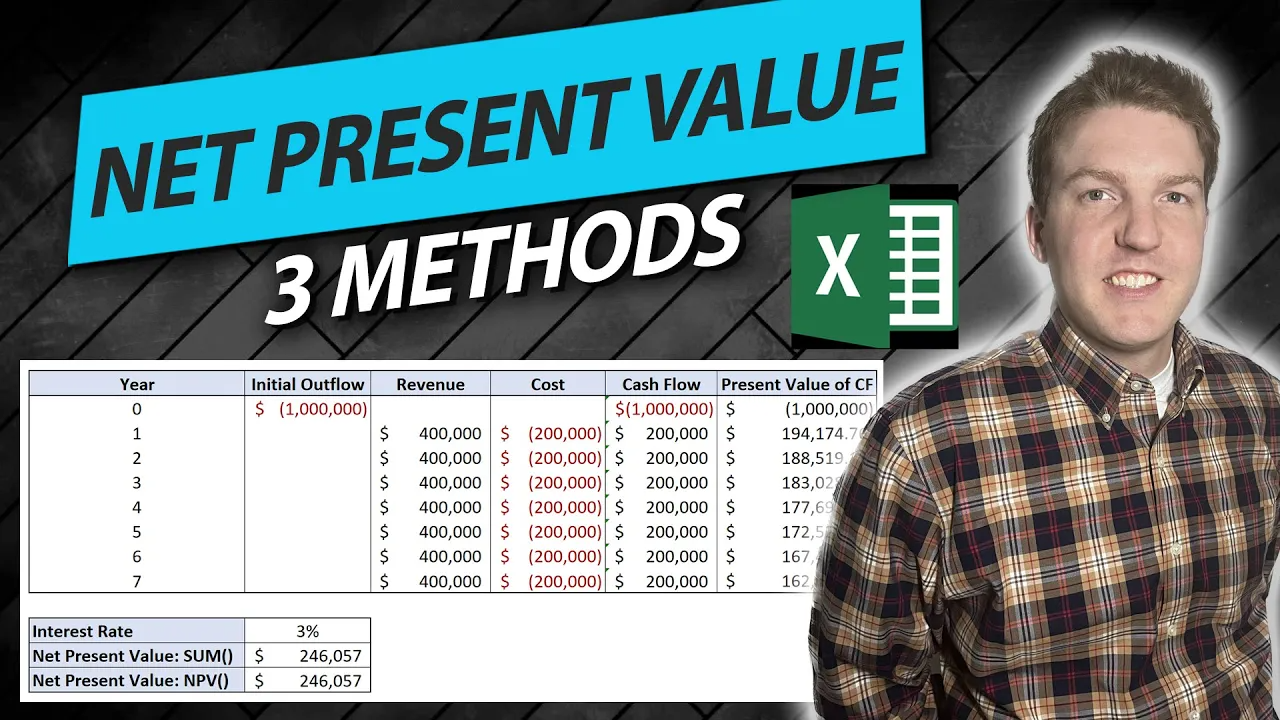
NPV Excel Template
The NPV Excel Template is a versatile and user-friendly tool designed to simplify the complex process of evaluating potential investment projects. This dynamic template incorporates both the NPV and XNPV functions of Excel, providing a seamless way to analyze your potential investments by comparing expected return versus risk. Perfect for beginners and experienced professionals alike, this downloadable and customizable tool comes with a comprehensive video guide segmented into easily digestible chapters. Note that this tool is intended for educational purposes, not as financial advice, and users should consult with a professional advisor before making any investment decisions.
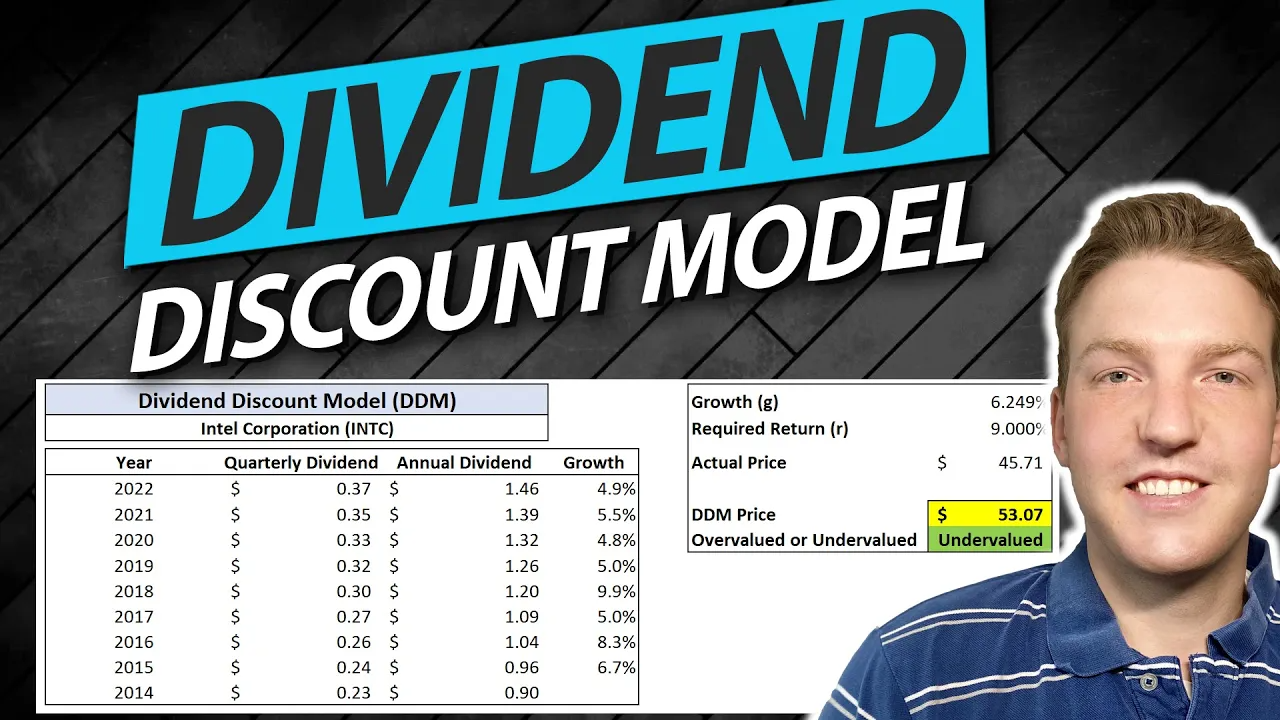
Stock Valuation Excel Spreadsheet Using Dividend Discount Model
The Stock Valuation Excel Spreadsheet is a powerful tool that enables users to systematically estimate a stock’s value using the Dividend Discount Model (DDM). It integrates functions for automatic data collection from Yahoo Finance, calculates the dividend growth rate and intrinsic stock price, and allows for a clear comparison between calculated and market prices to discern if a stock is overvalued or undervalued. Further, it employs Excel Solver to calculate the required return for investment. Ideal for both financial professionals and investing enthusiasts, this user-friendly, educational tool is freely available for download, bringing informed stock valuation conveniently to your fingertips. Please note, this tool is for informational purposes only and not a source of financial advice.
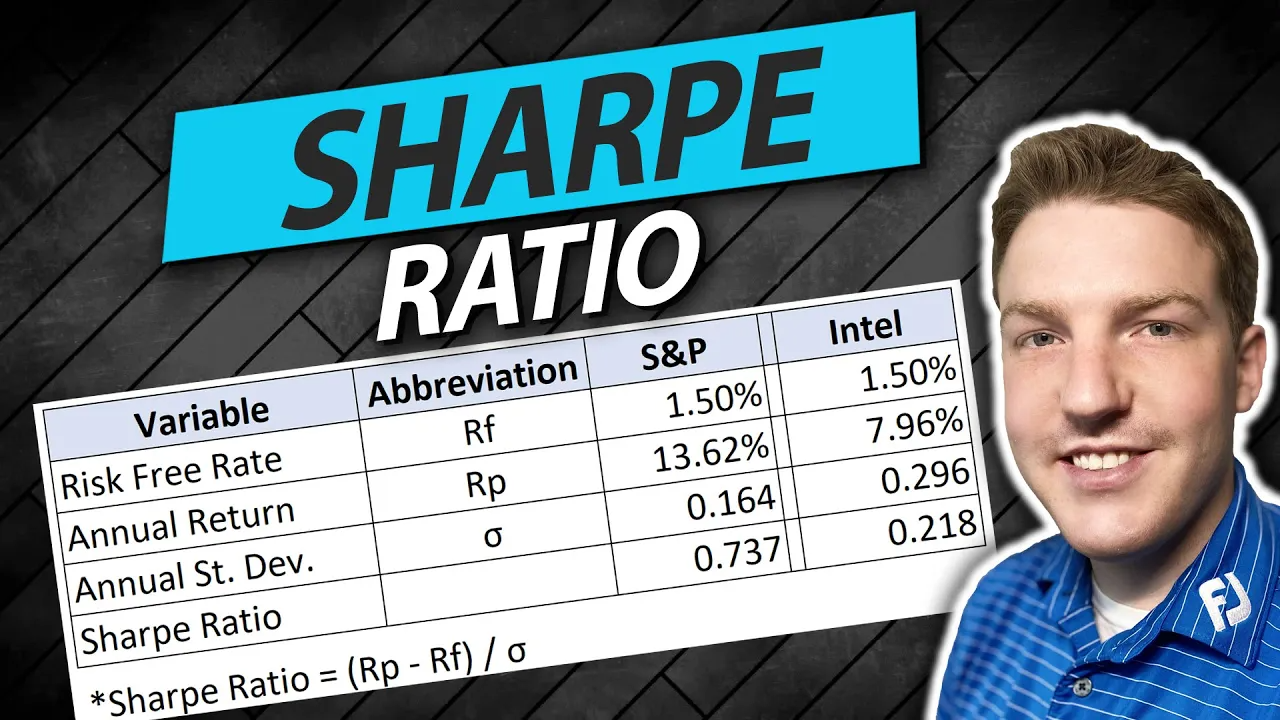
Sharpe Ratio In Excel
Sharpe Ratio In Excel file offered is a comprehensive and user-friendly tool designed to facilitate the calculation of investment performance metrics. With this file, users can import stock price data from Yahoo Finance, calculate daily and annual stock returns, determine the standard deviation of returns, and ultimately calculate the Sharpe Ratio—a key measure of risk-adjusted return. Ideal for investors, financial analysts, and portfolio managers, this free-to-download resource serves as both an educational guide and a practical tool for evaluating investment performance. Note: This does not constitute financial advice and users should consult with a qualified financial advisor for personalized advice.
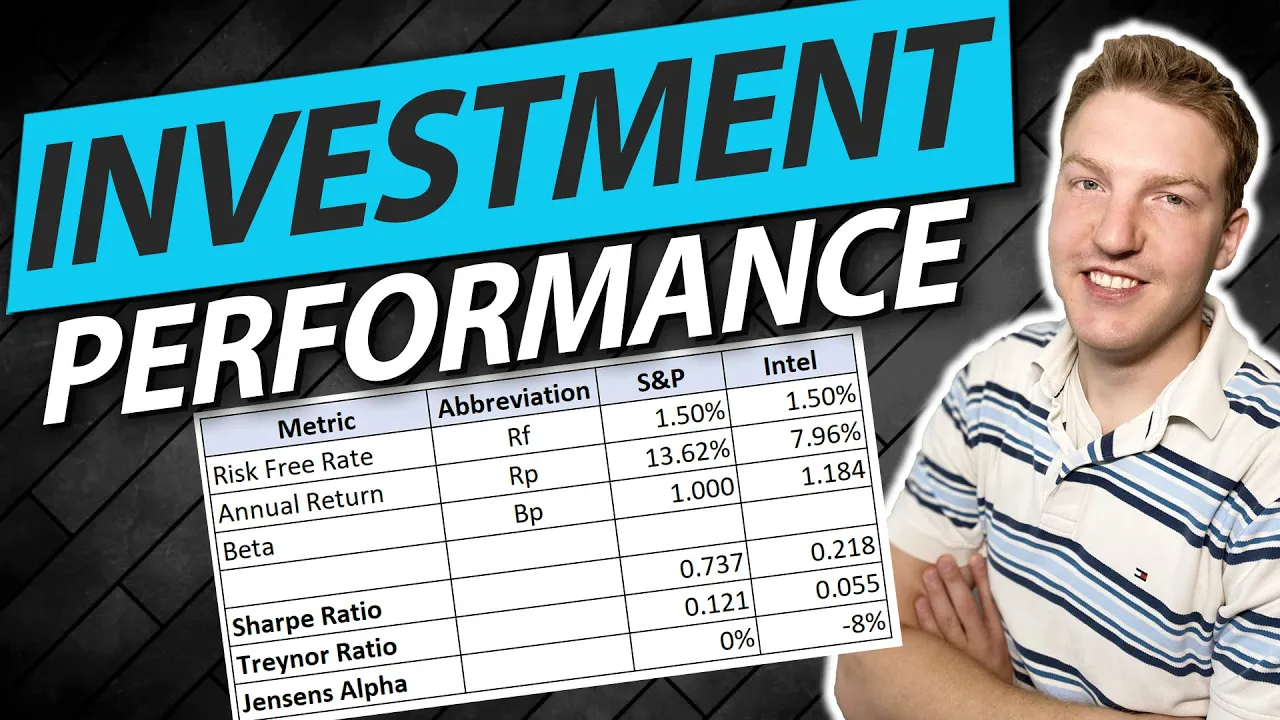
Investment Performance Evaluation Excel File
The Investment Performance Evaluation Excel File is a comprehensive tool perfect for investors, financial analysts, and students seeking to understand and evaluate stock performance. This dynamic Excel file simplifies the process of importing stock price data, calculating daily returns, and analyzing performance through widely accepted financial metrics: Sharpe Ratio, Treynor Ratio, and Jensen’s Alpha. Please note that this tool is for evaluation purposes and not intended as financial advice; users should always perform their own due diligence or consult with a financial advisor before making investment decisions.
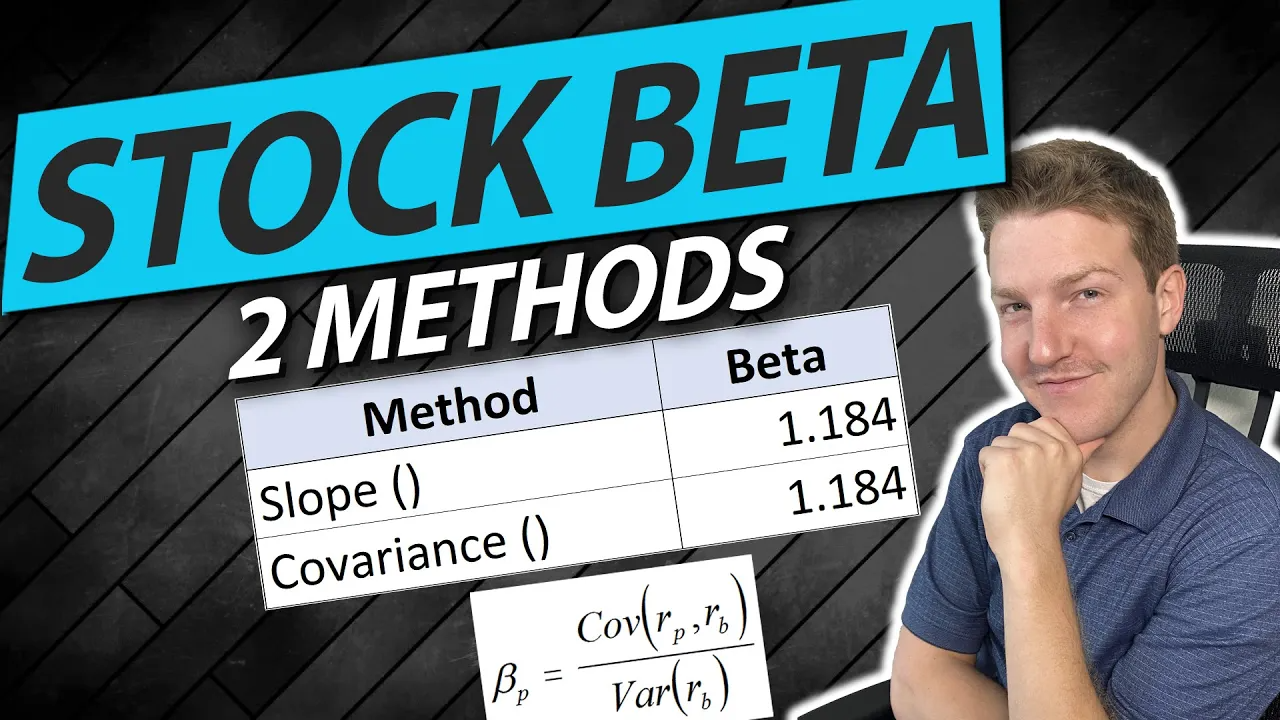
Estimating Beta of a Stock in Excel – An Interactive Excel File
The “Estimating Beta of a Stock in Excel” file is a comprehensive, user-friendly tool designed to educate users on calculating the beta of a stock, reflecting its volatility in relation to the market. This interactive Excel file elucidates the process of downloading stock price data from Yahoo Finance, computing daily stock price returns, and estimating the beta of a stock using Excel’s =SLOPE() and =COVARIANCE.P() functions. Ideal for self-learners and budding financial analysts, this tool offers a hands-on approach to enhancing your financial analytical skills while cautioning that it is not a source of financial advice but a learning aid.