Financial Models

Monte Carlo Method: Value at Risk (VaR) Excel Template
The Monte Carlo Method: Value at Risk (VaR) Excel Template is a comprehensive tool. Whether you’re a finance professional, a student, or a DIY investor, this template provides an intuitive guide for conducting advanced financial risk analysis. From calculating daily returns and security standard deviation to interpreting Value at Risk (VaR) through a histogram, this Excel template demystifies complex risk assessment techniques. Included is a free, downloadable file demonstrated in the video tutorial, allowing users to understand and apply the Monte Carlo VaR calculation process in a practical context. Remember, this tool is for educational purposes and should not be taken as financial advice. Leverage this resource to gain a clearer understanding of your portfolio’s risk and make more informed investment decisions.
Parametric Method: Value at Risk (VaR) Excel Template
Unleash your risk analysis potential with the Parametric Method: Value at Risk (VaR) Excel Template. This user-friendly template facilitates seamless calculations of daily returns, security standard deviation and covariance, portfolio assumptions, and portfolio variance and standard deviation, culminating in the calculation of Value at Risk (VaR) using the Parametric (Variance-Covariance) Method. While it doesn’t serve as financial advice, this tool is an invaluable asset for finance students, professionals, and enthusiasts, providing deep insights into portfolio risk management. Harness this dynamic resource to enhance your financial decision-making today.


Stock Portfolio Monte Carlo Simulation Excel Spreadsheet
Take your stock portfolio management to the next level with the Stock Portfolio Monte Carlo Simulation Excel Spreadsheet developed by Ryan O’Connell, CFA, FRM. This tool allows you to define assumptions about the S&P 500 Index, calculate your portfolio’s potential ending value, run Monte Carlo simulations, and analyze stock portfolio summary statistics. With the built-in histogram, you can easily visualize your simulation results, giving you a broad understanding of the potential outcomes of your investment strategy. While this powerful tool assists with your decision-making process, it is intended to complement, not replace, professional financial advice.
Binomial Interest Rate Trees Spreadsheet
The Binomial Interest Rate Trees Spreadsheet is an intuitive and robust financial tool to assist those studying for the CFA Level 2 examination or anyone seeking to enhance their understanding of financial modeling. This dynamic resource breaks down complex concepts such as Par Rates, Binomial Interest Rate Tree Estimation, Backward Induction of a 1 Year Par Bond, and calculation of Lower Bound Forward Rates, offering a practical, hands-on approach to learning. Designed to align perfectly with Ryan’s educational video content, this spreadsheet is an invaluable learning tool for aspirants and practitioners in the finance field. Remember, it’s an educational tool and should not replace professional financial advice.

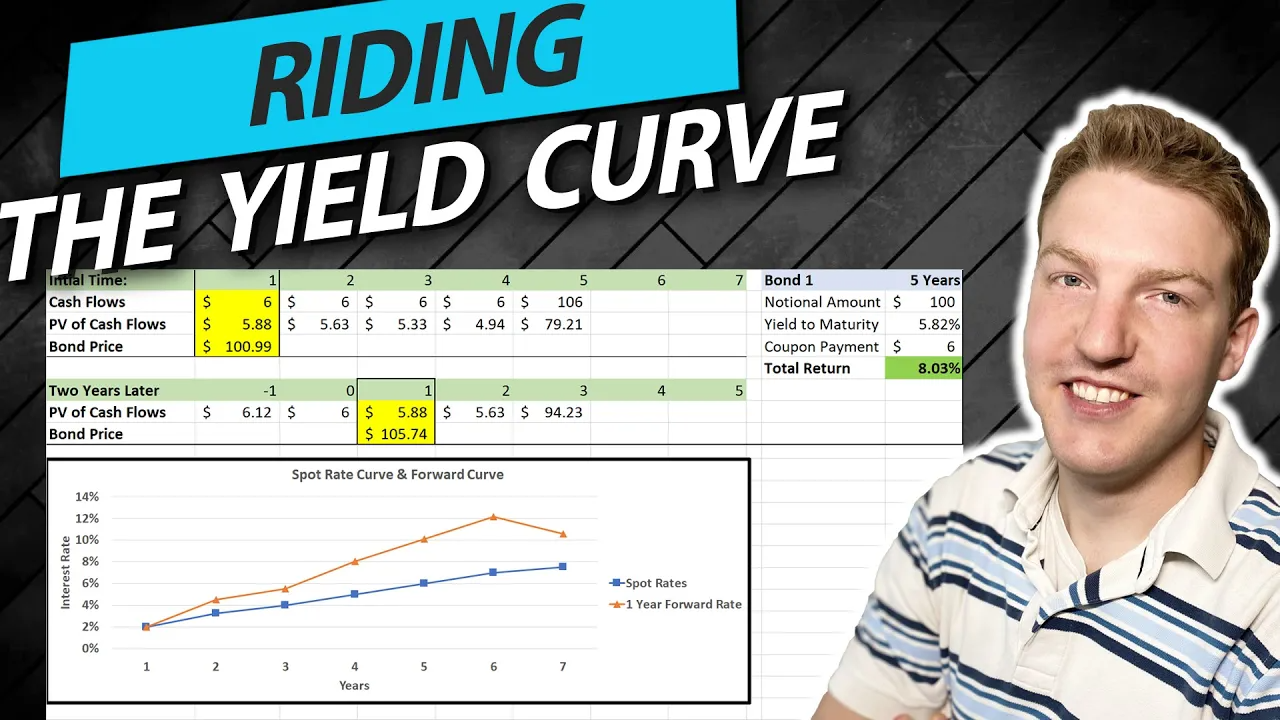
Yield Curve Analysis Spreadsheet Product Description
Enhance your financial analysis skills with the Yield Curve Analysis Spreadsheet. The spreadsheet helps demystify concepts of ‘riding the yield curve’ and ‘rolling down the yield curve’, making it an invaluable resource for both CFA Level 2 candidates and finance professionals. It’s an ideal way to learn and practice real-world yield curve calculations. Please remember that this tool is a learning resource, not financial advice.